Muslim Minorities Monitor’s Initial Analysis of 2021 Census Data Regarding the Muslim Population in England and Wales
Exclusive Report - Muslim Minorities Monitor
Summary:
- British Muslims continue to be the largest minority faith group and England and Wales.
- The population of Muslims in England and Wales is 3.87 million, accounting for 6.5% of the overall population of England and Wales.
- The Muslim population increased during the period of 2011 – 2021 by 1.16 million, or 44.44%.
- The increase of the Muslim population accounts for nearly third of the increase in the overall population of England and Wales.
- Muslim Minorities Monitor calls upon all relevant authorities and organisations to conduct an independent survey specifically targeting Muslim population, taking into account migrants seeking residence in the UK.
- Muslim Minorities Monitor calls upon all Muslim organisations to unify their media efforts to shed the light on the concerns and issues of the underrepresented Muslim communities.
- Muslim Minorities Monitor calls upon all Muslim organisations to unify efforts to study and analyse the full report of 2021 Census, when released, to produce a collaborated focussed report that better represents the reality of the Muslim minority in the UK.
ــــــــــــــــــــــــــــــــــــــــــــــــــــــــــــــــــــــــــــــــــــــــــــــــــــــــــــــــــــــــــــــــــــــــــــــــــــــــــــــــــــــــــــــــــــــــــــــــــــــ
Introduction:
On November 29, 2022, the Office for Nation Statistics (ONS) in the UK released a statistical bulletin derived from the data of 2021 Census, specifically regarding the religious affiliation of the residents of England and Wales.
According to the bulletin, the Muslim population in England and Wales increased by 1.6% since the last Census in 2011.
The data shows that approx. 3.9 million residents identified themselves as Muslims, compared to 2.7 million in 2011.
The data indicates that the Muslim population has grown by 44.44% (1.2 million) over the past 10 years. This does not include the Muslims of Northern Ireland nor Scotland.
The religion question in the survey was voluntary, however, nearly 94% of participants have answered the religion question.
Simplifying the Data:
1. Regional Data:
1a. Muslim Population in Proportion:
In London, the most religiously diverse city in England and Wales, the Muslim population accounts for 15% of the city’s residents, compared to 12.6% in 2011.
The Muslims in London form the second largest religious community in the city after the Christians.
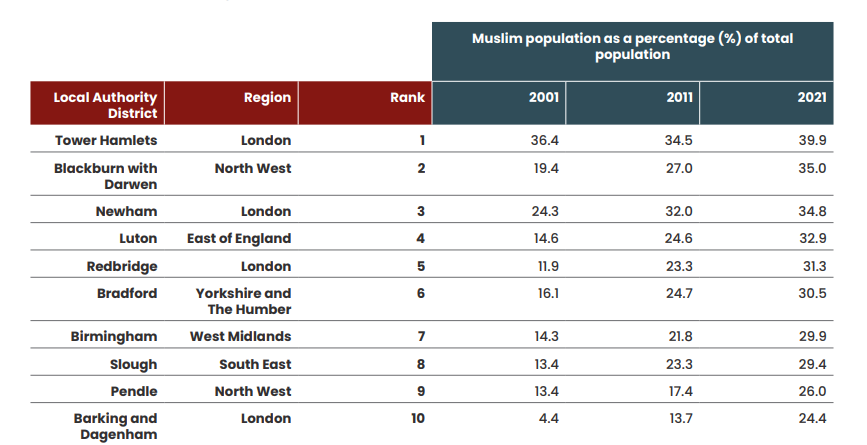
In relation to the overall population of each region, the largest Muslim communities in England and Wales was recorded in:
- Tower Hamlet (a London borough, East end of London), which recorded 39.9% of its residents as Muslims, up from 38% in 2011.
- Blackburn with Darwen (a borough and unitary authority area in Lancashire, North West England), which recorded 35% of its residents as Muslims.
- Newham (a London Borough, East of London), which recorded 34.8% of its residents as Muslims.
- Luton (a unitary authority with borough status in Bedfordshire), which recorded 32.9% of its residents as Muslims.
- Redbridge (a London Borough, North East of London), which recorded 31.3% of its residents as Muslims.
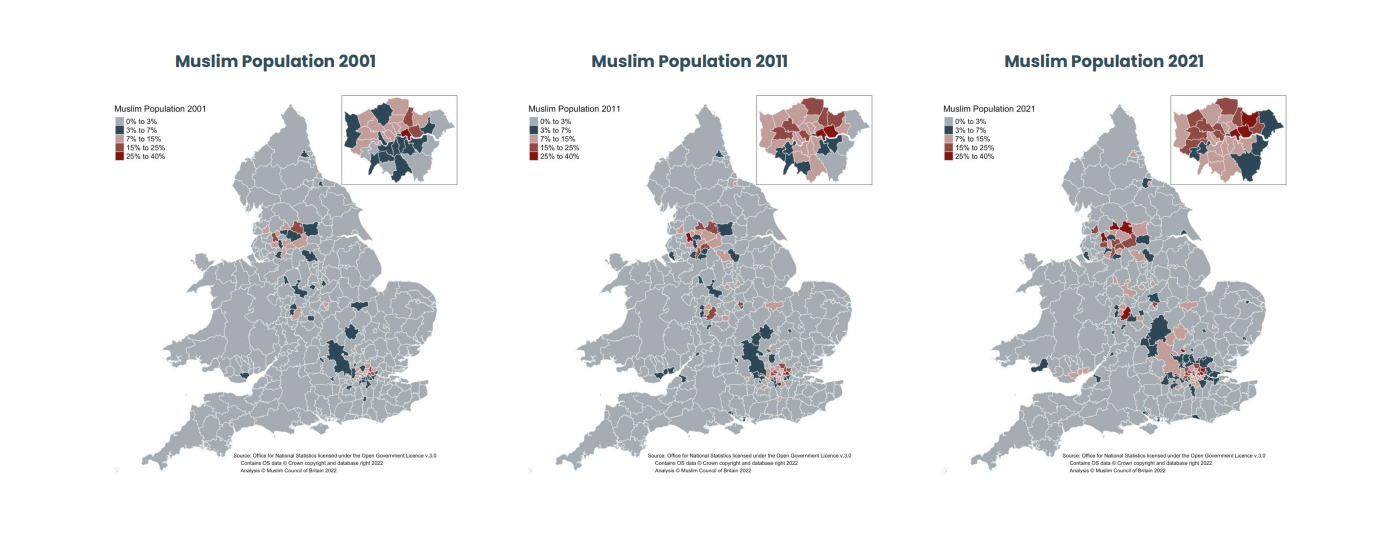
The following interactive map shows the density of Muslim population across England and Wales:
(Source: Office for National Statistics website).
1b. Muslim population in numbers:
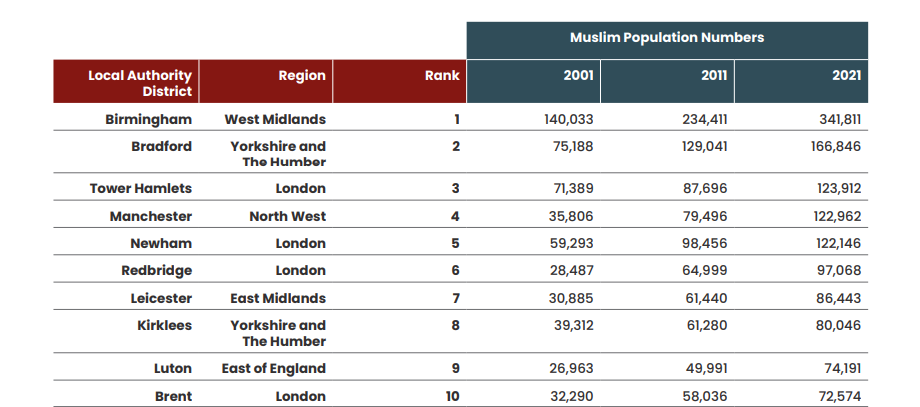
In terms of population density, the largest Muslim population was recorded in:
- Birmingham, in which 341,811 people identified themselves as Muslims.
- Bradford, in which 166.846 people identified themselves as Muslims.
- Tower Hamlets, in which 123,912 identified themselves as Muslims.
- Manchester, in which 122,962 identified themselves as Muslims.
- Newham, in which 122,146 identified themselves as Muslims.
1c. Muslim population in Wales:
notably, the Muslim population in Wales did not match that which is in England. The largest Muslim communities in Wales were recorded in:
- Cardiff, the Capital of Wales, in which 33,650 people identified themselves as Muslims, accounting for 9.3% of the overall population of Cardiff.
- Newport, in which 11,280 people identified themselves as Muslims, accounting for 7.1% of the overall population of Newport.
- Swansea, in which 7,640 people identified themselves as Muslims, accounting for 9.3% of the overall population of Swansea.
2. Comparing the data of 2001, 2011 and 2021:
2a. Top 10 Local Authority Districts (LADs) in Terms of Muslim Population:
The following table shows the number of Muslims in the top 10 Local Authority Districts (LADs) in terms of Muslim population.
(Table quoted from the report of the Muslim Council of Britain. Read the full report here)
2b. Top 10 Local Authority Districts (LADs) in Terms of Muslim Proportion:
The following table shows the percentage of Muslims in the top 10 Local Authority Districts (LADs).
(Table quoted from the report of the Muslim Council of Britain. Read the full report here).
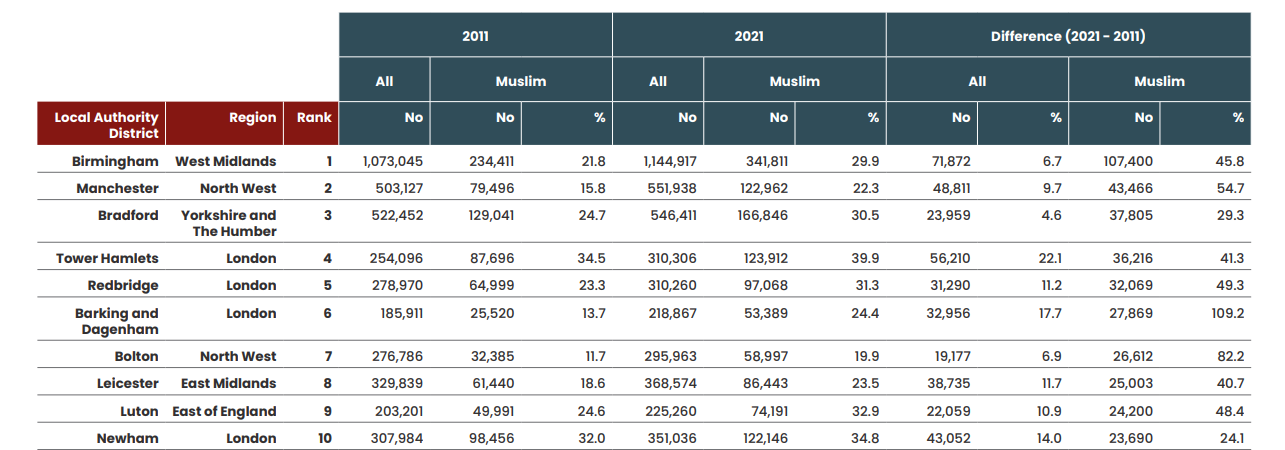
2c. Top 10 Local Authority Districts (LADs) in Terms of Muslim Proportion, Comparing the Data of 2011 and 2021):
The following table compares the data of 2011 census to the data of 2021 census shows the percentage of Muslims in the top 10 Local Authority Districts (LADs).
(Table quoted from the report of the Muslim Council of Britain. Read the full report here).
Muslim Minorities Mointor’s Analysis:
1. First look analysis:
- The religion question in the survey was optional. Despite that 94% of participants have answered the question, a problem still stands with the accuracy of the number of Muslims when compared between two or more region, as the response rate may vary from one region to another.
- British Muslims continue to be the largest minority faith group and England and Wales.
- The population of Muslims in England and Wales is 3.87 million, accounting for 6.5% of the overall population of England and Wales.
- The Muslim population increased during the period of 2011 – 2021 by 1.16 million, or 44.44%.
- The increase of the Muslim population accounts for nearly third of the increase in the overall population of England and Wales.
- The top 5 LADs remain the same in almost all of the lists, with minor difference in ranking.
- The population of Muslims have doubled between 2001 and 2021.
- The increase in Muslim percentage in proportion to the population of the city or LAD in which they live varies significantly, from nearly 10% increase in Tower Hamlets to nearly 600% in Barking and Dagenham.
- The majority of Muslims reside in the urban areas, boroughs and deprived districts.
2. Geographical Analysis:
- Muslim population in England continues to grow and their geographic disperse continues to spread wider throughout England. However, in Wales, the disperse of Muslim population seems to be less spread.
- Muslim population is more spread over England than most other minority faith groups, e.g., Jews and Sikh.
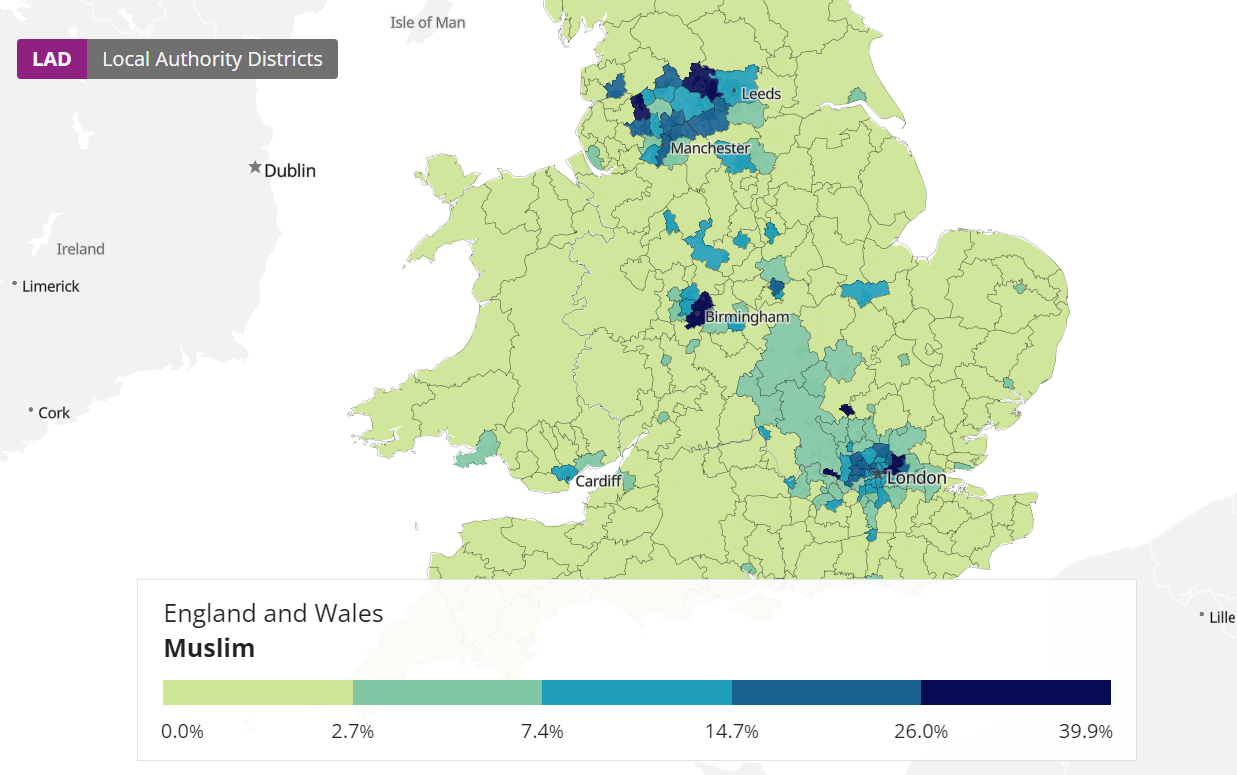
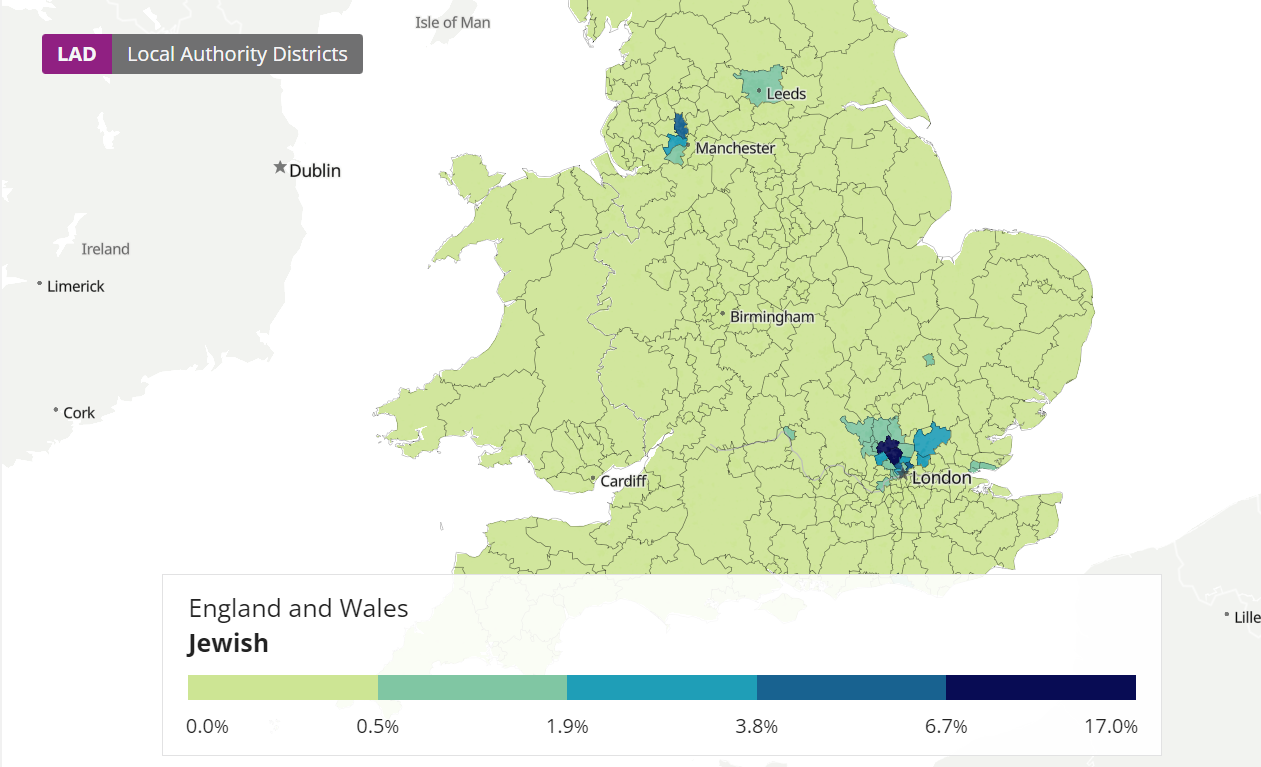
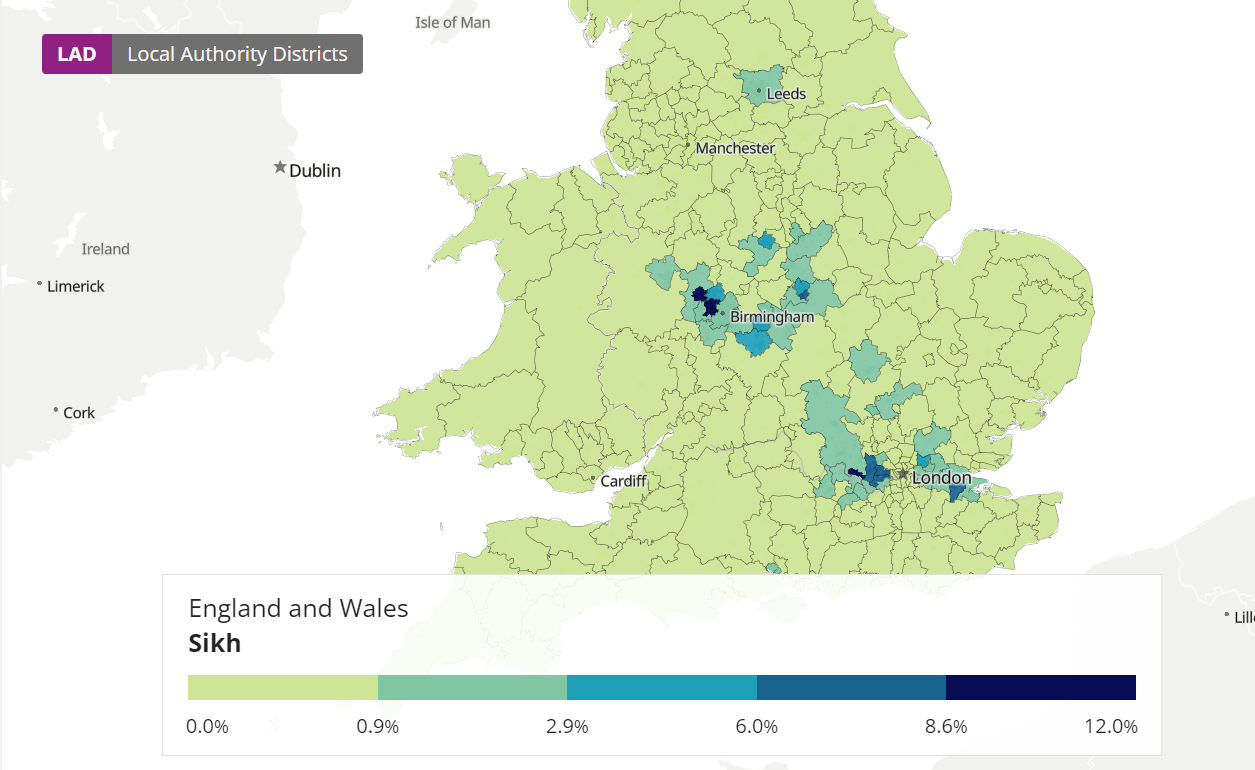
- London remains to have the highest number of dependent boroughs with high Muslim population.
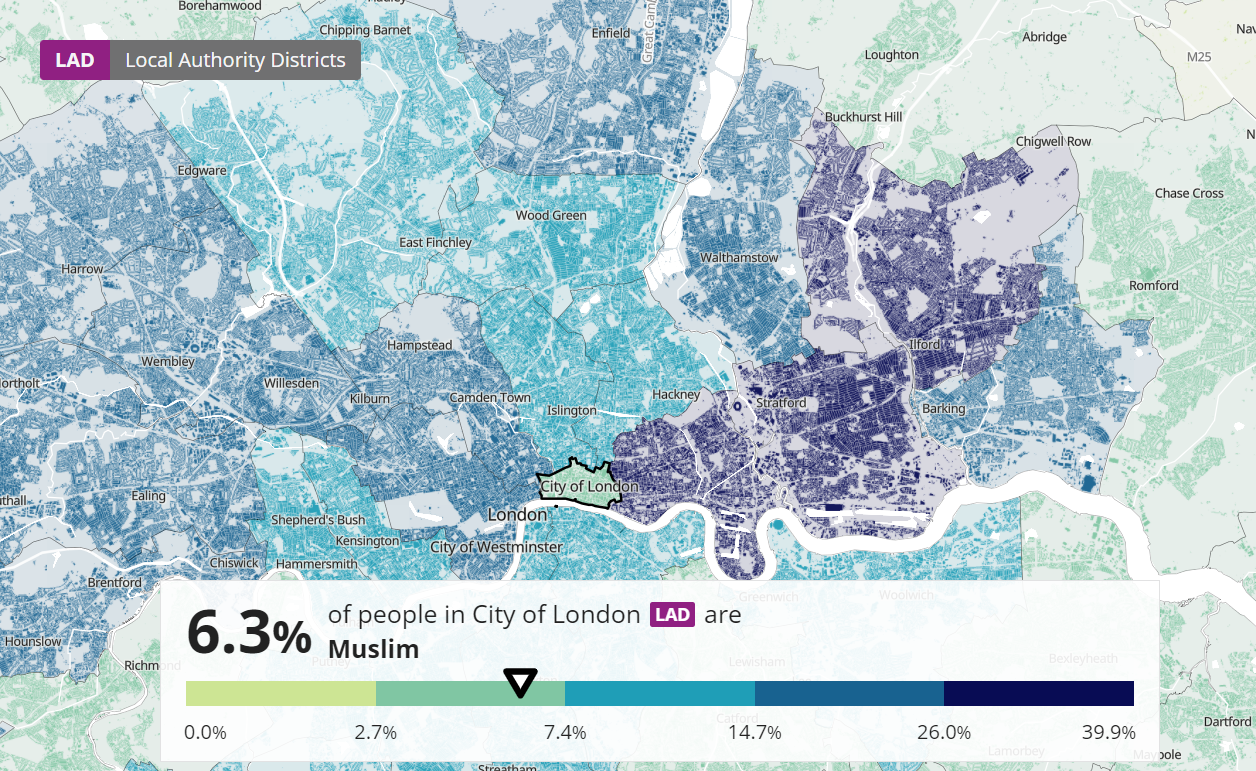
- Muslims of Wales remain in the minority in comparison with the Muslims of England.
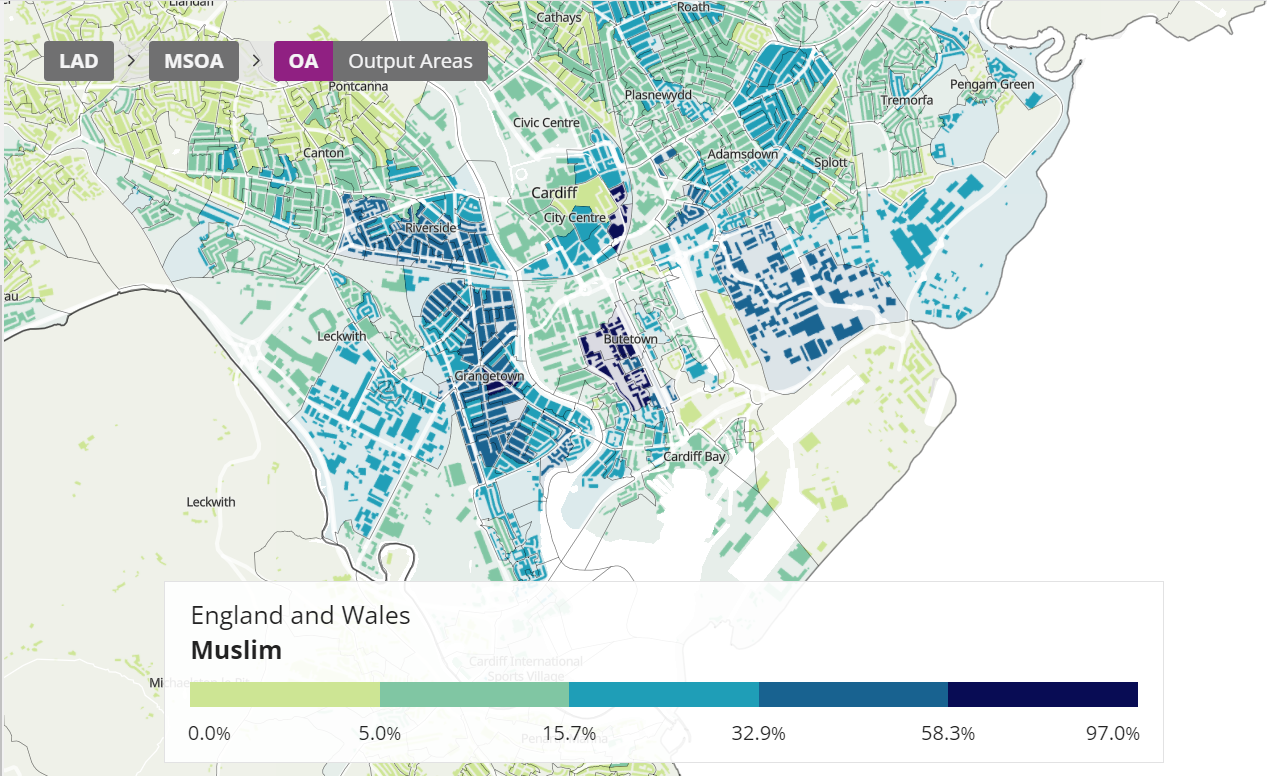
- The majority of Welsh Muslims reside in Cardiff, most of them in the Southern part of the city.
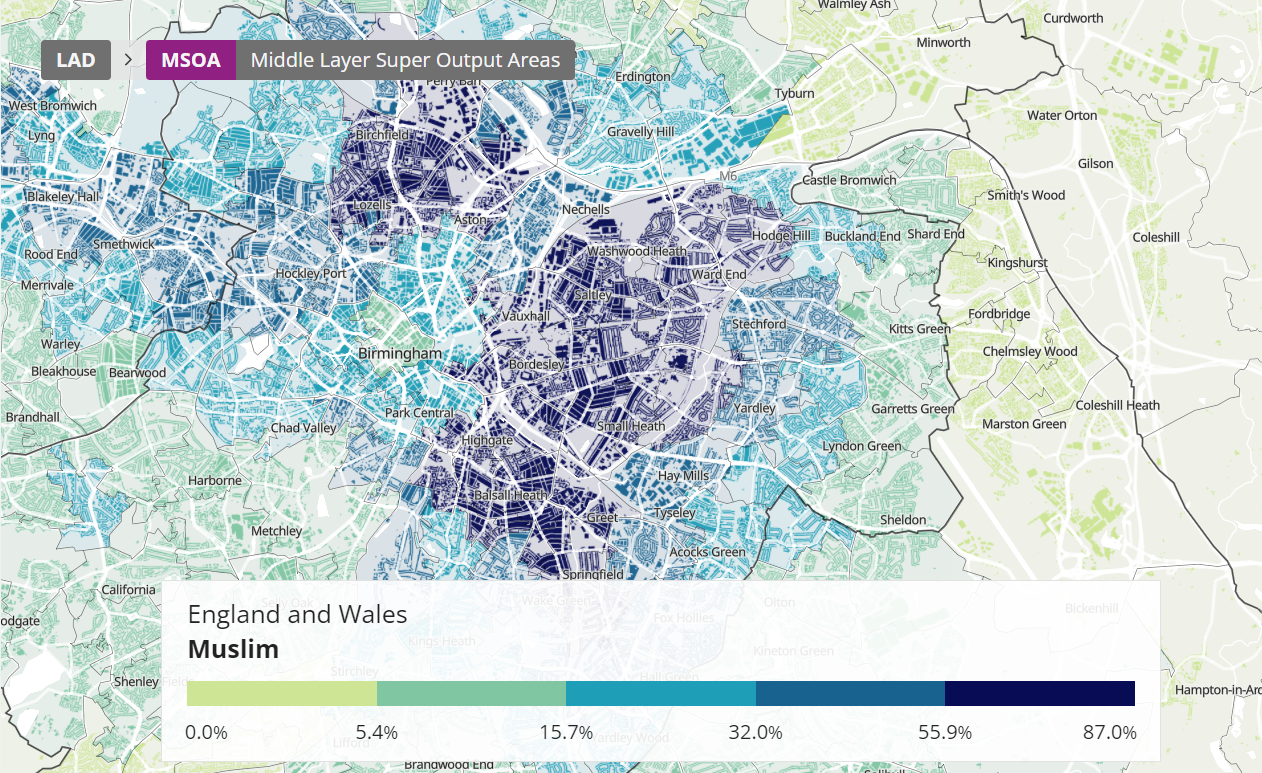
- Birmingham holds the larger community of Muslims in England with over 340,000 Muslims, scattered over most parts of the East and Centre of the city.
3. Deprivation Analysis:
[The following segment was quoted in its entirety from the report of MCB report. Read the full report here]
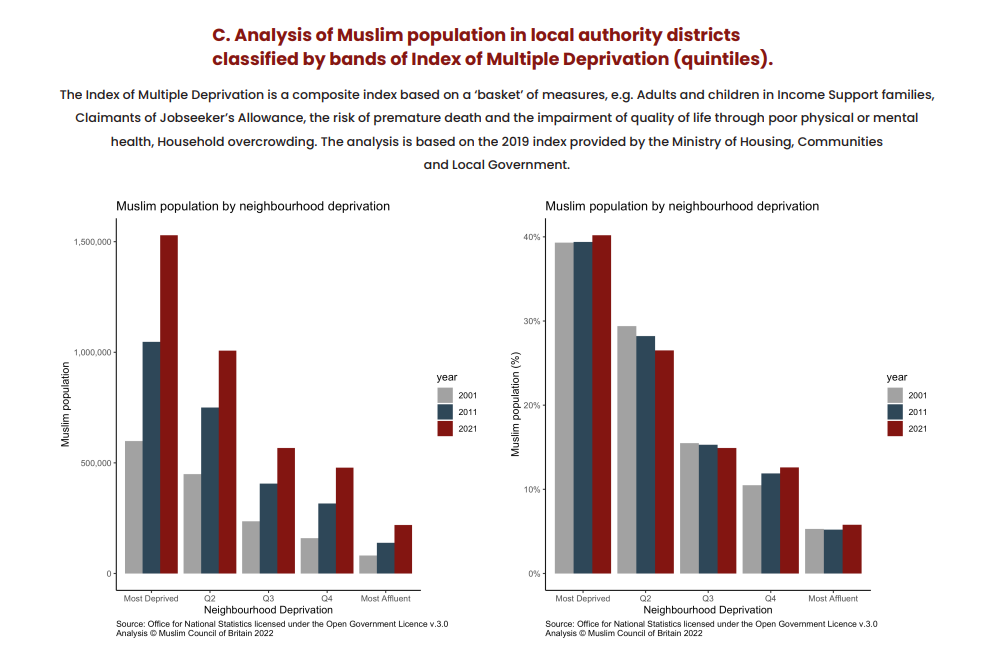
MCB’s analysis linking Census data with the Index of Multiple Deprivation indicates that 40% of the Muslim population of England reside in the most deprived fifth of local authority districts; almost 482,000 more Muslims now live in the most deprived locales than in 2011.
Just under 6% of Muslims live in the most affluent fifth of local authority districts.
Muslim communities have had to bear the consequences of inner-city settlement with 99% of the Muslim population living in urban areas in 2011 as compared to 82% of the overall population. The Government’s ‘Levelling Up the United Kingdom’ programme has identified the need for resource allocation in rural local authority districts, but if this policy is to deliver a truly equitable allocation of resources, then the needs of deprivation in our urban centres also need to be addressed.
The onus is on policy makers to engage with representative community bodies who are aware of ground realities and the lived experience of deprived pockets in society.
Recommendations:
Based on the presented data above, and the initial analysis, Muslim Minorities Monitor recommend the following:
- We call upon all relevant authorities and organisations to conduct an independent survey specifically targeting Muslim population, taking into account migrants seeking residence in the UK.
1a. This independent survey must be carried out in collaboration with a diverse Muslim led organisations to establish a trust baseline that guarantees comprehensive community participation and accurate results.
2b. This independent survey must take into account the issues and concerns of Muslim community and the lack or shortage of services or privileges caused by either geographical locations, difficulties with local communities, political anti-Muslim agendas such as Islamophobia, or other reasons. - We invite Muslim organisations to join existing umbrella organisations that represent the Muslims, and for the umbrella organisations to form an alliance to lobby and advocate for the most affected and underrepresented Muslim communities.
- We call upon all Muslim organisations to unify their media efforts to shed the light on the concerns and issues of the underrepresented Muslim communities.
- We call upon all Muslim organisations to unify efforts to study and analyse the full report of 2021 Census, when released, to produce a collaborated focussed report that better represents the reality of the Muslim minority in the UK.
ـــــــــــــــــــــــــــــــــــــــــــــــــــــــــــــــــــــــــــــــــــــ
Sources:
- Muslim Minorities Monitor.
- Office for National Statistics (ONS), released 29 November 2022, ONS website, statistical bulletin, Religion, England and Wales: Census 2021.
- Muslim Council of Britain (MCB), Census 2021 First Look, November 2022.

